Live Testing Session
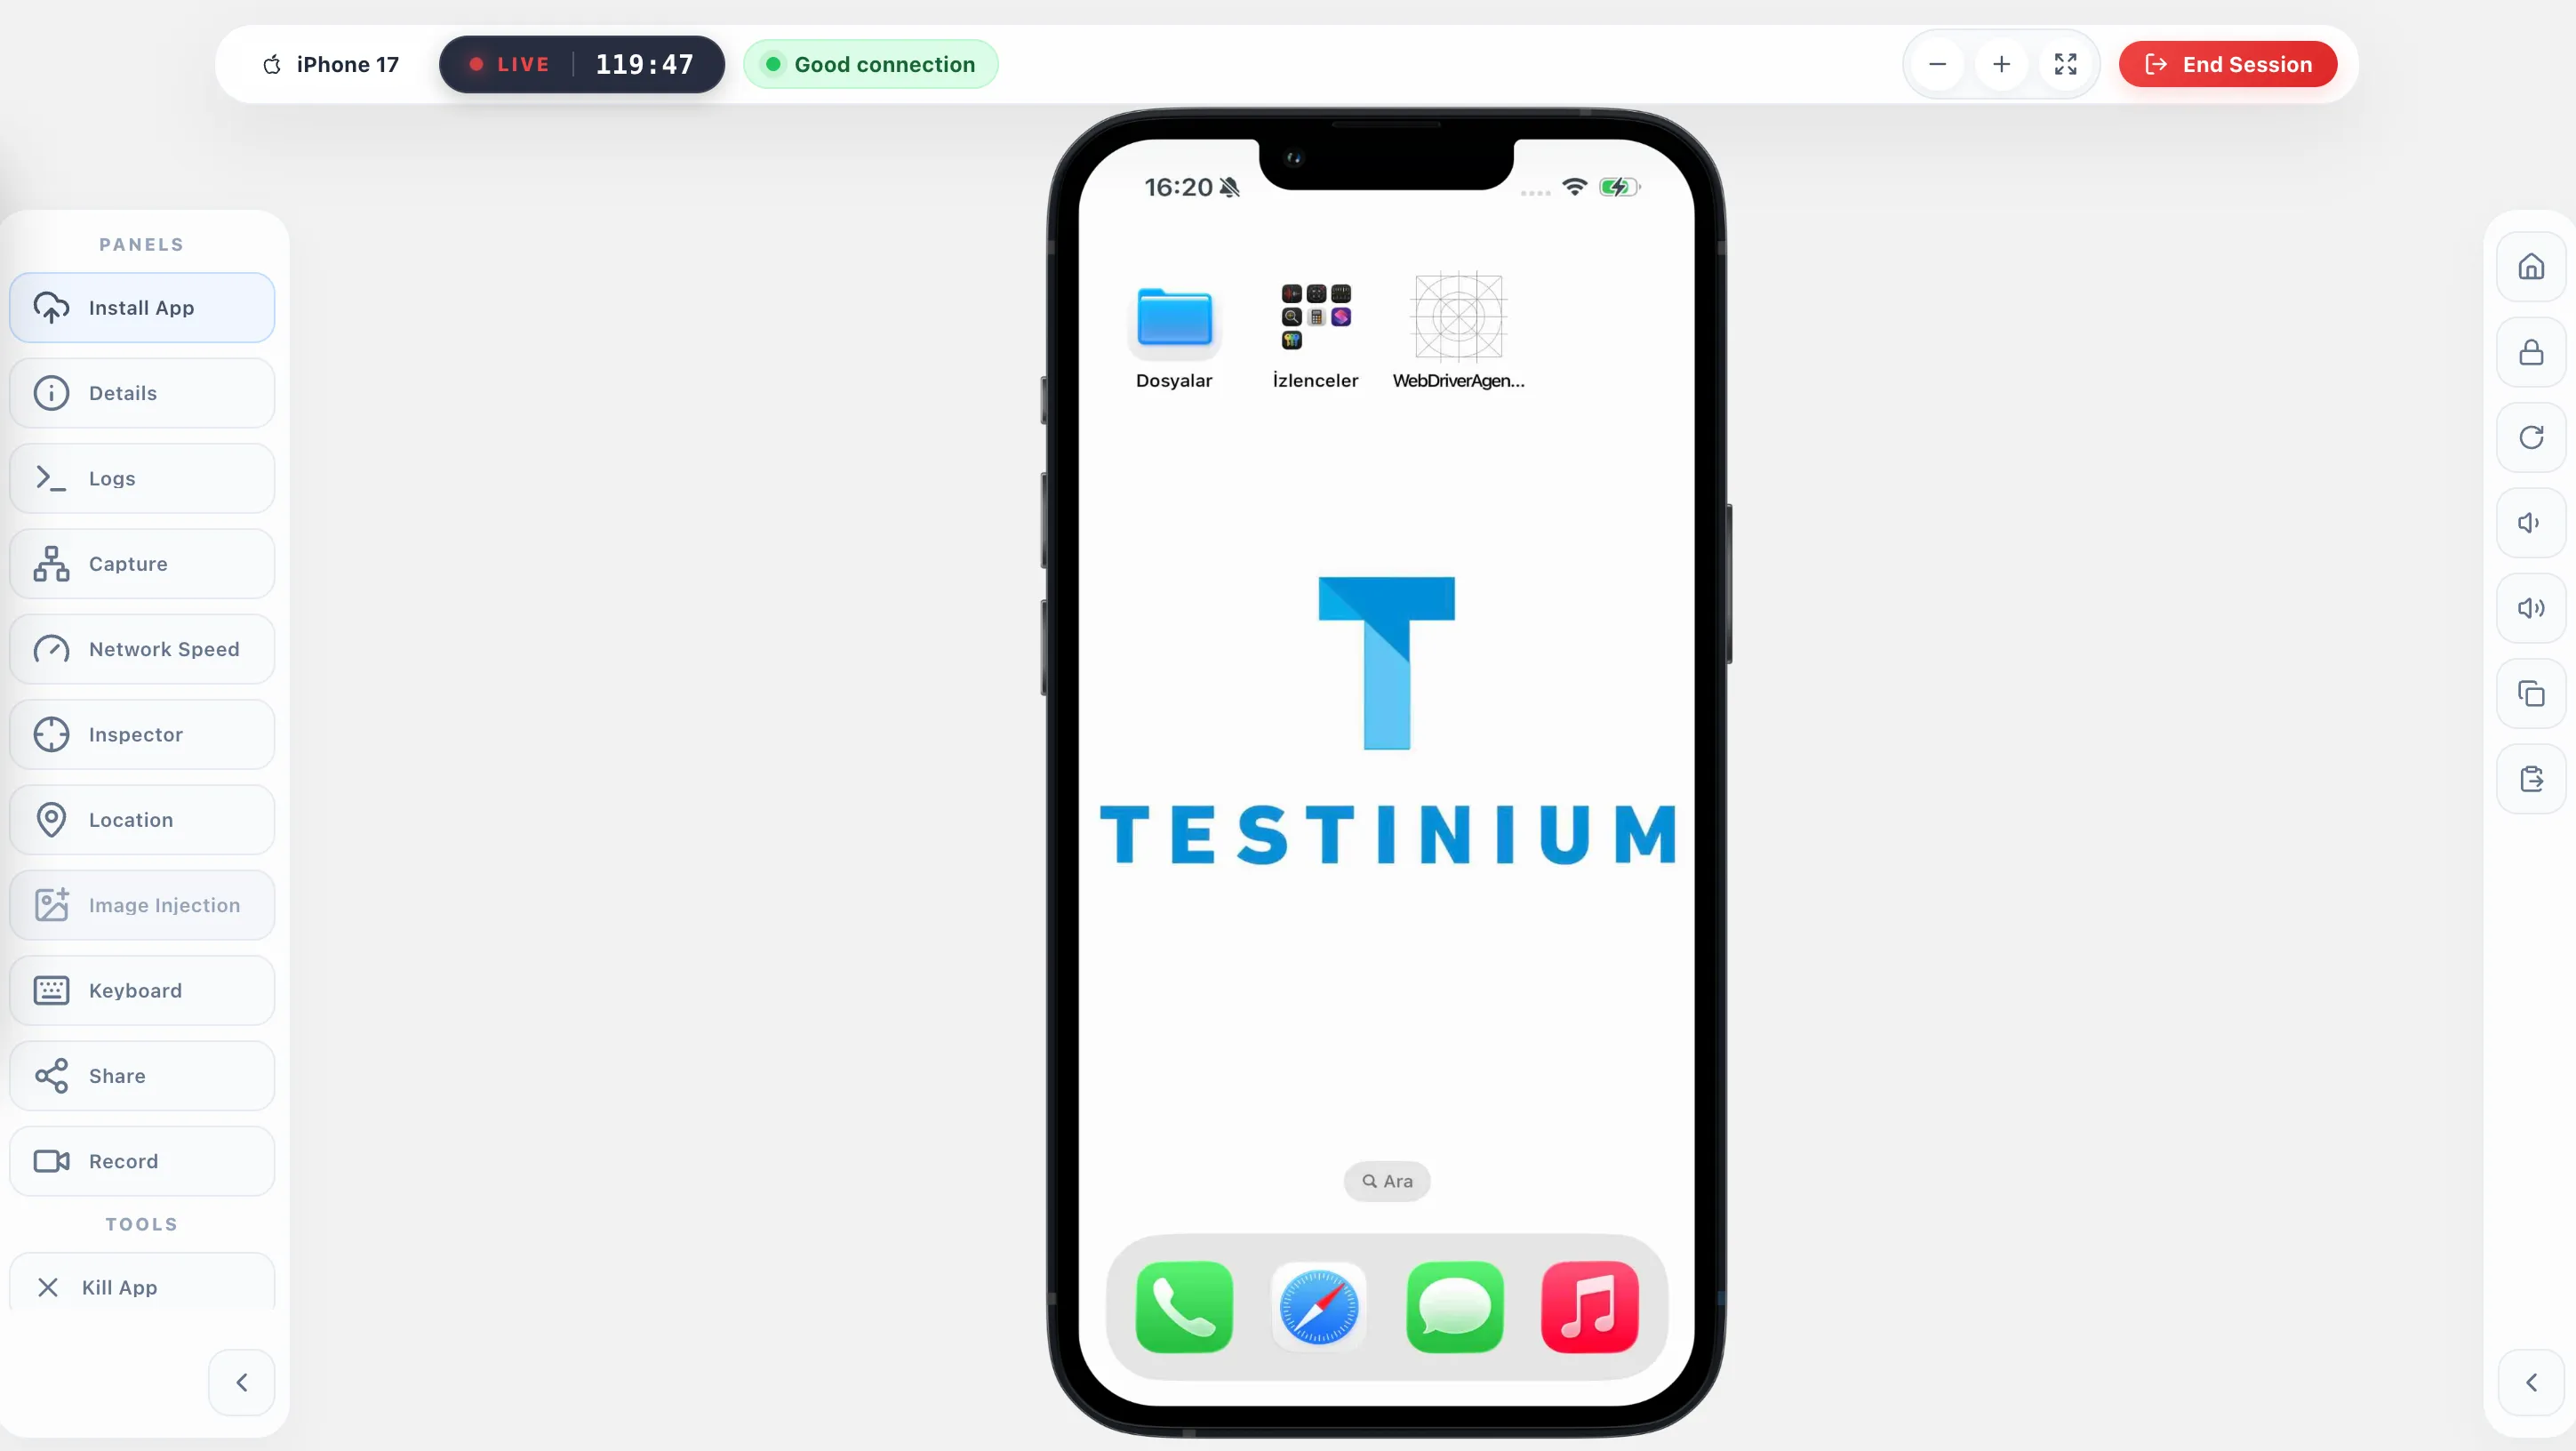
The Live Testing Session is the main workspace for remotely interacting with a mobile device in real time.
After launching an available device from the Device List, the device is streamed directly to the browser. Users can navigate the device, interact with applications, install builds, reproduce test scenarios, and use built-in debugging and testing tools without requiring physical access to the device.
Session Workspace
The device screen is displayed at the center of the workspace and can be controlled directly through the browser.
The top session bar provides information about the active session, including:
- Device Model – Displays the device currently being used.
- LIVE Indicator – Indicates that the Live Testing session is active.
- Session Timer – Shows the duration of the current session.
- Connection Quality – Displays the current connection quality between the browser and the remote device.
- View Controls – Allow the device view to be zoomed in, zoomed out, or displayed in full screen.
- End Session – Ends the current session and releases the device.
Additional device controls are available from the toolbar on the right side of the workspace, while testing and debugging capabilities are grouped in the panels on the left.
Install App
The Install App panel provides quick access to applications that have already been uploaded through the Apps page.
Saved applications can be installed directly on the connected device without uploading the application package again. This makes it easier to switch between different builds or reinstall an application during a session.
Installing a Saved Application
Applications stored in the company's application library are displayed under Saved Applications.
Select Install next to the required application to install it on the active device.
This is particularly useful when working with Public Devices, where applications may need to be installed again after the device has been reset between sessions.
Uploading During a Session
A new application can also be uploaded directly from the session.
Applications uploaded from this panel are also saved to the Apps page, allowing the same package to be reused in future sessions.
Enabling Image Injection
When installing an application, Image Injection can be enabled before installation.
Installing the application with this option enabled prepares that application for use with the Image Injection capability during the session.
Logs
The Logs panel provides diagnostic information that can be monitored during the active session.
It contains separate views for App Debug and CPU.
App Debug
App Debug allows users to monitor debugging logs for a selected application.
Users can select the application to monitor and work with the generated logs directly from the session. The panel also provides controls for filtering, clearing, and downloading the collected log output.
This can be useful when reproducing an application issue and additional technical information is required for investigation.
CPU
The CPU view monitors the overall CPU utilization of the connected device.
CPU values are collected during monitoring and displayed visually in the session. The recorded values can also be downloaded as a text file for further analysis or sharing.
Unlike App Debug, CPU monitoring represents the general CPU usage of the device, rather than the usage of a specific application.
Network Capture
The Capture panel allows network traffic to be captured for a selected application.
To capture network traffic:
- Select the application from the dropdown.
- Click Start Capture.
- Perform the required actions on the application.
- Stop the capture when the required traffic has been collected.
- Use Export PCAP to download the captured network data.
The resulting PCAP file can then be used for further network analysis with compatible tools.
Network Speed
The Network Speed panel allows supported devices to be tested under simulated network conditions.
Instead of testing only with the device's normal connection, users can select predefined network profiles representing different connectivity conditions, such as:
- No throttling
- Complete packet loss
- Very poor network conditions
- Poor Edge network conditions
- Average Edge network conditions
Each profile applies predefined characteristics such as bandwidth, latency, and packet loss.
This makes it possible to observe how an application behaves when network quality decreases, requests take longer to complete, or connectivity is interrupted.
Inspector
The Inspector allows users to inspect UI elements displayed by the application.
It can be useful when:
- Identifying elements while developing automated tests
- Finding element attributes and XPath information
- Understanding the application's element hierarchy
- Sharing specific element information with developers when investigating UI-related issues
Before inspecting elements, click the Refresh button in the Screen Map area. This captures the current state of the device screen and retrieves its element structure. Elements can then be selected from either the Screen Map or the Element Tree to examine their attributes.
The Inspector separates the information into areas such as:
- Selected Element – Displays attributes and values for the currently selected element.
- Element Tree – Displays the hierarchical structure of elements on the screen.
- Screen Map – Displays the captured device screen and allows elements to be selected visually.
Location
The Location panel allows the device's location to be mocked during the active session.
Users can select a location from the map or provide coordinates manually and apply that location to the device. Applications that use device location can then be tested as if the device were located at the selected position.
Location mocking is not a VPN. It changes the location reported by the device for testing purposes; it should not be considered a network or VPN capability.
Keyboard
The Keyboard panel provides a virtual keyboard and text input area for entering text on the remote device.
Text entered in the panel is sent to the currently active input field on the device. This can be especially useful when entering longer values, credentials, URLs, or characters that are difficult to type through the device's on-screen keyboard.
The panel provides:
- Text Input – Enter or paste text before sending it to the active field.
- Paste – Pastes clipboard content into the text input area.
- Clear – Clears the prepared text.
- Send – Sends the entered text to the active field on the device.
- Virtual Keyboard – Provides common letters, numbers, spaces, backspace, Enter, and other keyboard actions directly from the browser.
Physical keyboard input also works while the Live Testing page is focused. The Keyboard panel can be useful when browser shortcuts, keyboard layouts, or locale-specific characters make direct input unreliable.
Share
The Share panel allows the current Live Testing session route to be shared with teammates.
Click Copy share link to copy the session URL and send it to another team member.
The shared link does not provide additional environment permissions. The recipient must already have access to the corresponding Testinium environment in order to access the shared session.
This can be useful when:
- Reproducing an issue together with another team member
- Asking a developer to review an application problem
- Collaborating during exploratory testing
- Sharing an active device session without manually directing another user to the same device
Record
The Record panel uses the browser's screen capture functionality to record testing activity during the current Live Testing session.
Click Choose Screen to Record to open the browser's native screen-sharing picker. Users can select:
- Browser Tab – Records a selected browser tab
- Window – Records a selected application or browser window
- Entire Screen – Records the complete screen
After selecting a source, recording begins and continues until Stop is clicked.
Once the recording is stopped, a preview becomes available in the panel so the user can review it before downloading.
The recording is downloaded in WebM format.
Recordings are available only during the current Live Testing session and are not stored in Testinium Suite. Users should download the recording before ending the session if they want to keep it.
Recordings can be useful for:
- Capturing defect reproduction steps
- Recording unexpected application behavior
- Creating evidence for bug reports
- Sharing exploratory testing results
- Demonstrating complete user flows to developers or other team members
Because recording is based on the browser's screen capture functionality, only the tab, window, or screen selected by the user is recorded.
Screenshot
The Screenshot tool captures the current screen of the remote device.
Click Capture whenever a device screenshot is required. Multiple screenshots can be collected during the same Live Testing session and are displayed together in the Screenshot area.
Captured screenshots can be managed individually or as a group.
Available actions include:
- Capture – Takes a new screenshot of the current device screen.
- Download All – Downloads all screenshots collected during the session.
- Clear – Removes the collected screenshots from the Screenshot area.
- Edit – Opens an individual screenshot for editing.
- Download – Downloads an individual screenshot.
- Delete – Removes an individual screenshot.
Screenshots can be used as test evidence, attached to defect reports, or shared with team members when documenting application behavior.
Kill App
The Kill App tool immediately terminates the currently active application on the device.
This is useful when a test requires the application to be completely closed rather than simply moved to the background.
For example, Kill App can be used to:
- Test application behavior after a fresh restart
- Reproduce scenarios that require the application process to be terminated
- Recover from an unresponsive application
- Validate startup or initialization behavior
The action takes effect immediately, allowing the application to be reopened and testing to continue without ending the Live Testing session.
Install App
The Install App panel provides quick access to applications that have already been uploaded through the Apps page.
Saved applications can be installed directly on the connected device without uploading the application package again. Users can also upload a new application directly from the active session; applications uploaded this way are also added to the Apps library for future use.
When Image Injection is enabled during application installation, the installed application is prepared for use with the Image Injection capability.
This makes Install App particularly useful for quickly switching between builds such as production, pre-production, staging, or previous application versions without leaving the active device session.