All-in-One Report
All-in-One is a dispatch methoddispatch method that runs scenarios in a user-defined order within a single shared environment (such as a mobile device or browser) and execution session, keeping the environment active throughout the entire execution.
Since all scenarios run within a single shared environment and execution session, the All-in-One Report brings together their results, logs, and execution artifacts in one combined report.
Unlike One-by-One execution, which generates separate artifacts (execution log, screenshot, video etc.) for each scenario, All-in-One execution generates one shared set of artifacts, including the execution video and screenshots, for the entire execution.
Open the report
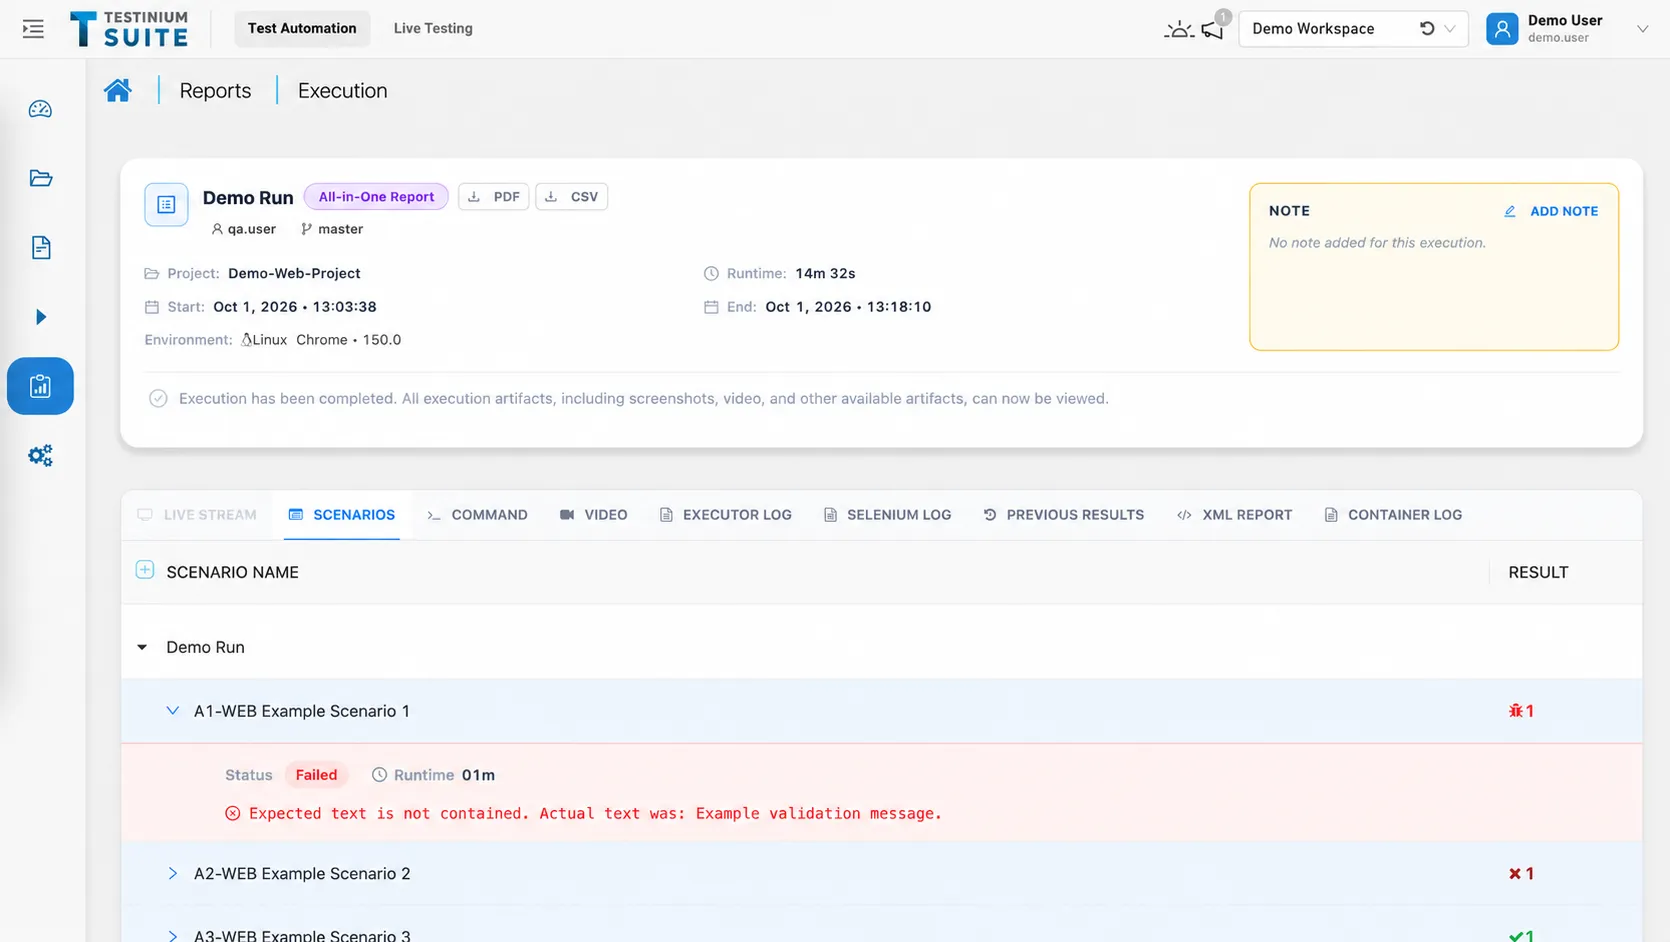
Go to Reports and open an All-in-One execution. The All-in-One Report badge beside the execution name identifies this report type. Hover over the badge to see an explanation of the shared execution model.
Execution overview
The summary at the top of the page provides the execution details:
Field | Description |
|---|---|
Execution name | Name of the selected execution. |
User | User associated with the execution. |
Branch | Source code branch used for the execution. |
Project | Project containing the executed tests. |
Start and finish | Execution start and finish timestamps. |
Runtime | Reported execution duration. |
Environment | Operating system, browser, and browser version used for the execution. |
A message beneath the summary indicates when execution has completed and the available artifacts are ready to view.
Completed does not mean every scenario passed. Review the scenario results to determine the outcome of the tests.
Live Stream
The Live Stream tab lets you watch web and mobile tests (mobile is not available yet but coming soon) while the execution is in progress. It becomes unavailable when the execution finishes.
Each execution supports one viewer at a time. While one user is watching the live stream, another user cannot watch the same execution’s stream.
Review scenario results
The Scenarios tab displays the scenarios included in the execution, organized under their parent group.
To inspect a scenario:
- Expand its parent group if it is collapsed.
- Find the scenario and review its result indicator.
- Expand the scenario row to view its details.
Expanded scenario details include the status, runtime, and any displayed error message.
Scenario results become available only after the entire execution has finished.
For a failed scenario, use the error message as the starting point for investigation. For example, a visibility timeout indicates that an expected element did not become visible within the specified waiting period.
Then review the execution logs and video, when available, to understand what happened around the failure.
View logs and execution artifacts
Use the tabs above the scenario list to access the available execution information.
Tab | Purpose |
|---|---|
Live Stream | Access the live execution view when available. |
Scenarios | Review scenario results after the execution finishes and expand individual scenarios to view their details. |
Command | Review scenario steps, such as “click element” or “perform scroll,” and view the screenshots stored for each command. |
Video | Review the shared execution recording, when available. |
Executor Log | Inspect output from the test executor. |
Selenium Log | Inspect Selenium output for troubleshooting. |
Appium Log | Inspect Appium output for troubleshooting. Generated for Appium projects. |
Previous Results | Access earlier results for comparison. |
XML Report | Access the execution report in XML format. |
Tab and artifact availability depends on the execution. Live Stream is available only while the execution is running.
Shared execution context
Logs, recordings, and other artifacts belong to the combined execution session. When investigating a particular scenario, read its result alongside the relevant information in the shared artifacts.
Add an execution note
Use Add Note in the Note panel to record context about the execution, such as:
- A known issue affecting the results.
- Relevant test data or environment conditions.
- Investigation findings or follow-up work.
Export the report
Use the PDF or CSV export options near the execution title to download the report in the required format.
Suggested review workflow
- Confirm the project, branch, and environment in the execution overview.
- While the execution is in progress, use Live Stream to watch web or mobile tests. Each execution supports one viewer at a time.
- Once the execution finishes, open Scenarios to review the results. Scenario results are available only after the entire execution has finished.
- Expand failed scenarios to inspect their status, runtime, and error messages.
- Review the shared logs and available recordings for supporting evidence.
- Check Previous Results for earlier outcomes.
- Add a note with relevant findings and export the report if needed.