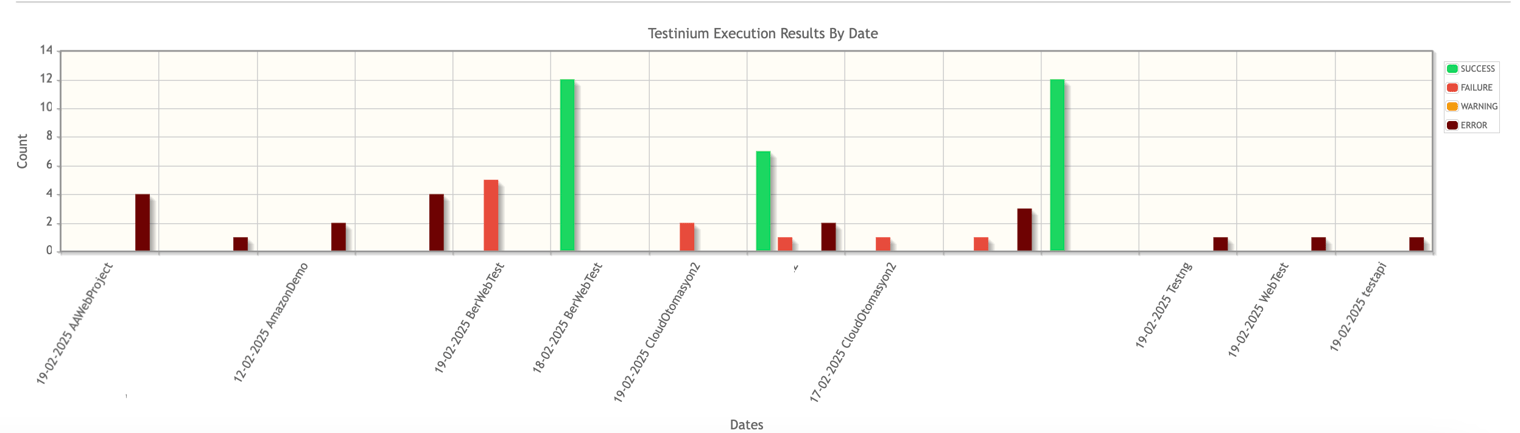
Execution Graph
2 min
Execution Graphs is a report screen where the numbers of the test execution results of the projects according to certain criteria are displayed as graphs.
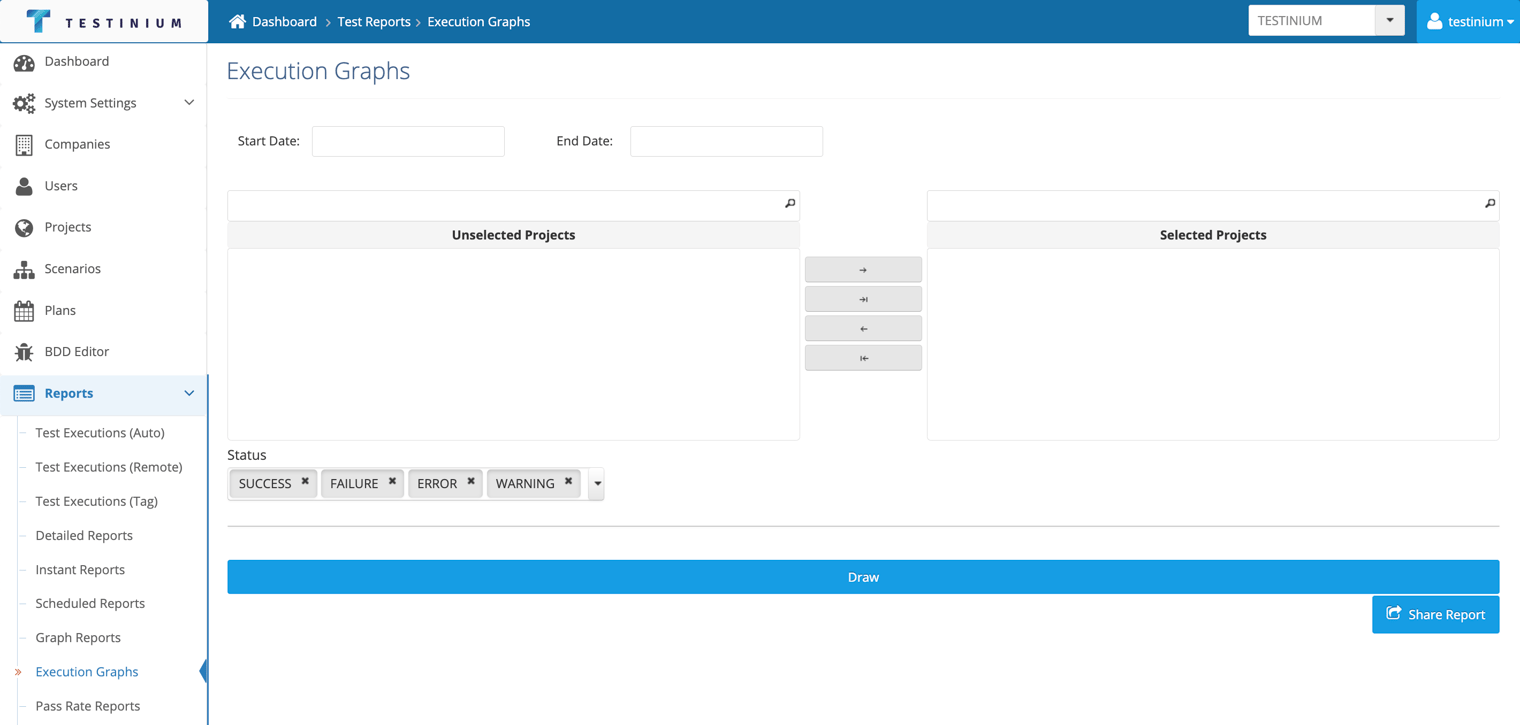
Graphs are created by following the steps below;
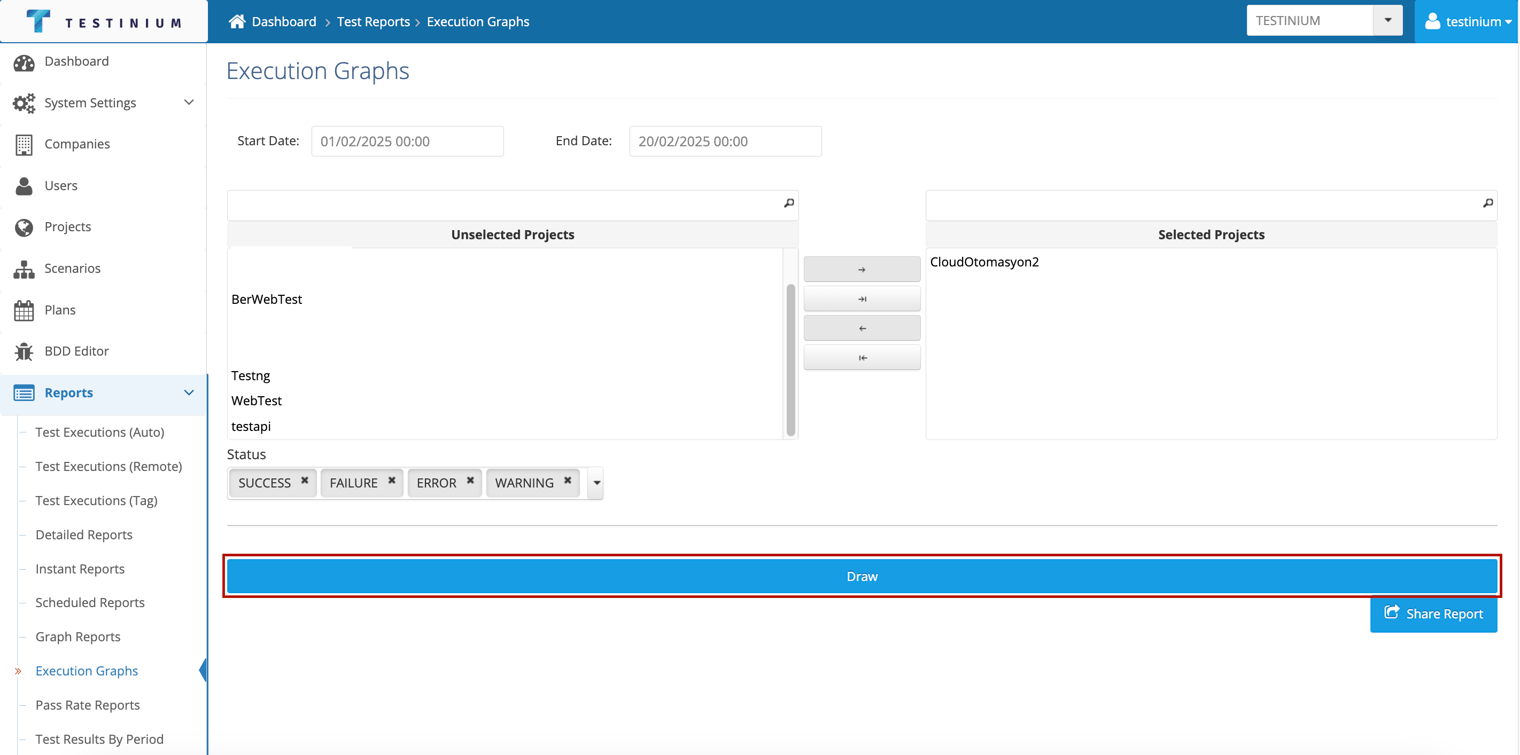
- Enter the date range.
Projects within this selected date range appear in the Unselected Projects field.
- Move the projects from Unselected Projects to Selected Projects.
- Select the status of projects.
- Click the Draw to create the graphics.
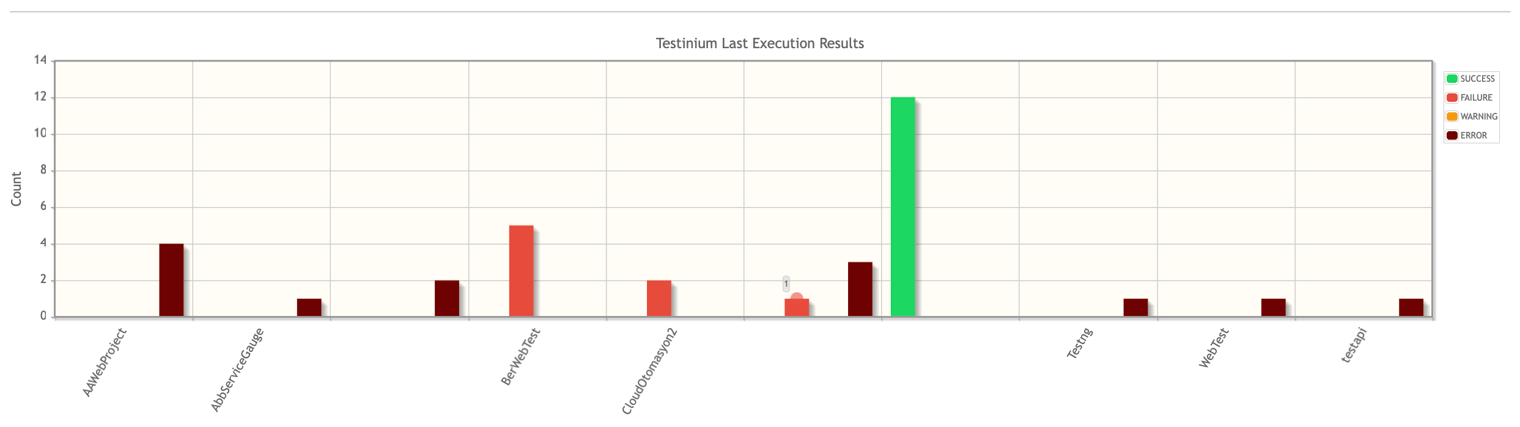
- The screen displays three graphs.
- Testinium Total Execution Results; number of total test runs by status.
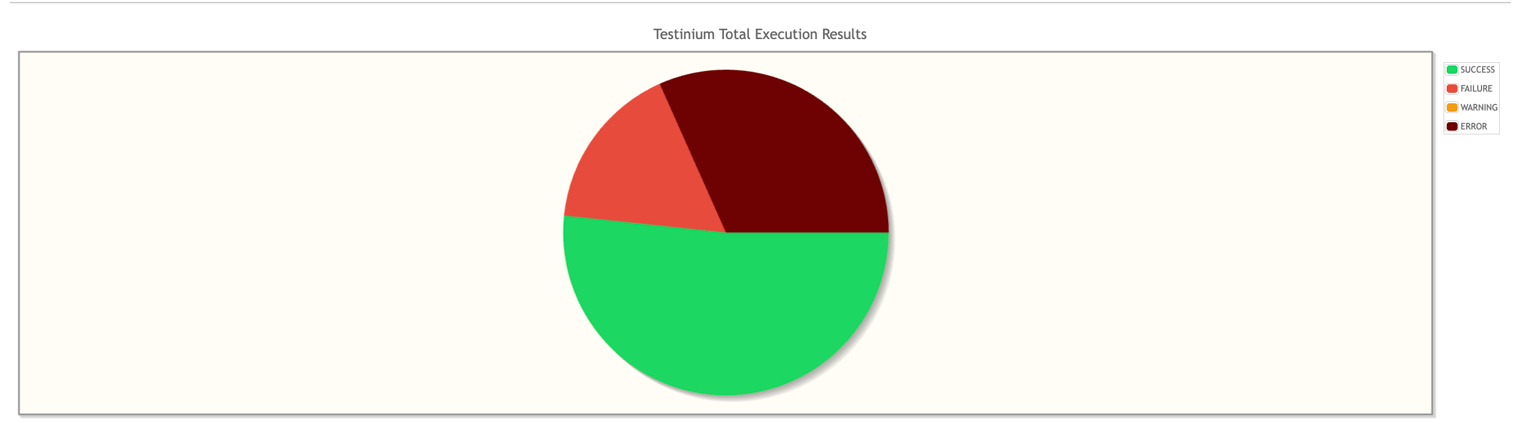
- Testinium Total Execution Results; number of last runs by status.
- Test Execution Result By Date; number of test results to run dates by status.