Dashboard (OP)
The Dashboard is the first page you see after signing in to Testinium Suite. It shows how your tests ended in a selected period, and it counts the projects, users, scenarios and test plans in your workspace and the tests that are running now.
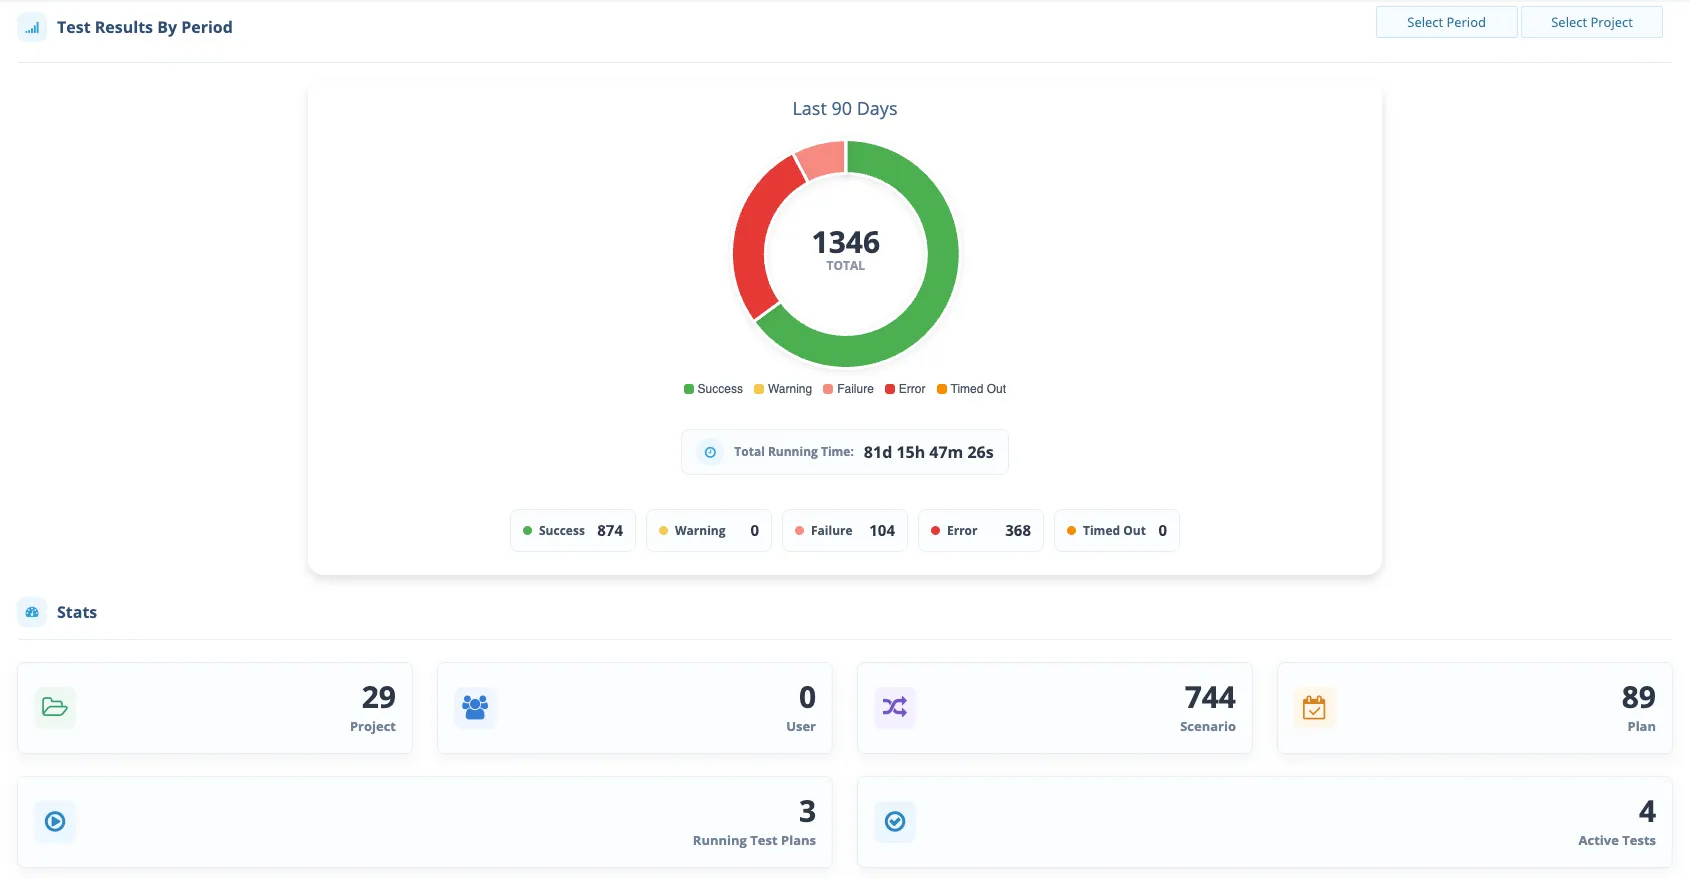
The page has two sections:
- Test Results By Period: how your test runs ended in the selected period, and the total running time.
- Stats: how many of each main item your workspace has, and what is running now.
Test Results By Period
This section summarizes the results of the tests that ran in the selected period. By default, it shows results for Today across all your projects.
Filter the results
Use the two buttons in the top-right corner of the section:
- Select Period: Choose the time range to display. The selected period appears as the chart title, for example “Today”.
- Select Project: Show results for a single project only.
Results chart
The donut chart shows how the test results are split by status. The number in the center is the total number of test results in the selected period. Each colored segment shows the share of one status.
The chart uses the following statuses:
- Success: The test completed and passed.
- Warning: The test completed, but with warnings.
- Failure: The test completed, but one or more checks failed.
- Error: The test could not complete because of an error, for example in the test code or the test environment.
- Timed Out: The test went over its maximum allowed execution time and was stopped.
Below the chart, a counter for each status shows the exact number of results. A count of 0 means no test ended with that status in the selected period.
Total Running Time
Total Running Time is the combined execution time of the tests in the selected period, shown in minutes and seconds.
Stats
The Stats section shows how many of each main item your workspace has and what is running now.
Project
The number of projects in your workspace. Each project contains its own scenarios, test plans and results.
User
The number of users in your workspace.
Scenario
The total number of test scenarios across all projects. A scenario is a single automated test.
Plan
The total number of test plans across all projects. A test plan defines which scenarios run, in which environments and with which settings.
Running Test Plans
The number of test plans that are running right now.
Active Tests
The number of tests that are running right now. One running test plan can contain several active tests, so this number can be higher than Running Test Plans.
Frequently asked questions
- Why are all results shown as 0?
- No test has finished in the selected period. Choose a longer period with Select Period, or check that the right project is selected.
- Does the Dashboard update automatically?
- The values reflect the latest data when the page loads. Refresh the page to see the most recent results.
- Where can I see the details of a failed test?
- Open the related test plan’s execution report. It includes the status of each scenario, along with screenshots, logs and video recordings.
- Where can I find my Testinium Suite version?
- The version number appears in the bottom-left corner of the page.
- How is Total Running Time calculated?
- Total Running Time is the sum of the run times of every scenario execution in the selected period. Retries count too: when a failed scenario is retried, the run time of each retry is added to the total. For example, say a scenario fails and is retried three times. The run times are: First run: 0m 09s Retry 1: 0m 08s Retry 2: 0m 07s Retry 3: 0m 08s The four runs add 0m 32s to Total Running Time, even though only one scenario was tested. Total Running Time does not include server or environment preparation time. Only the time scenarios spend running is counted. For this reason, Total Running Time can be shorter than the end-to-end duration of the test plan execution.